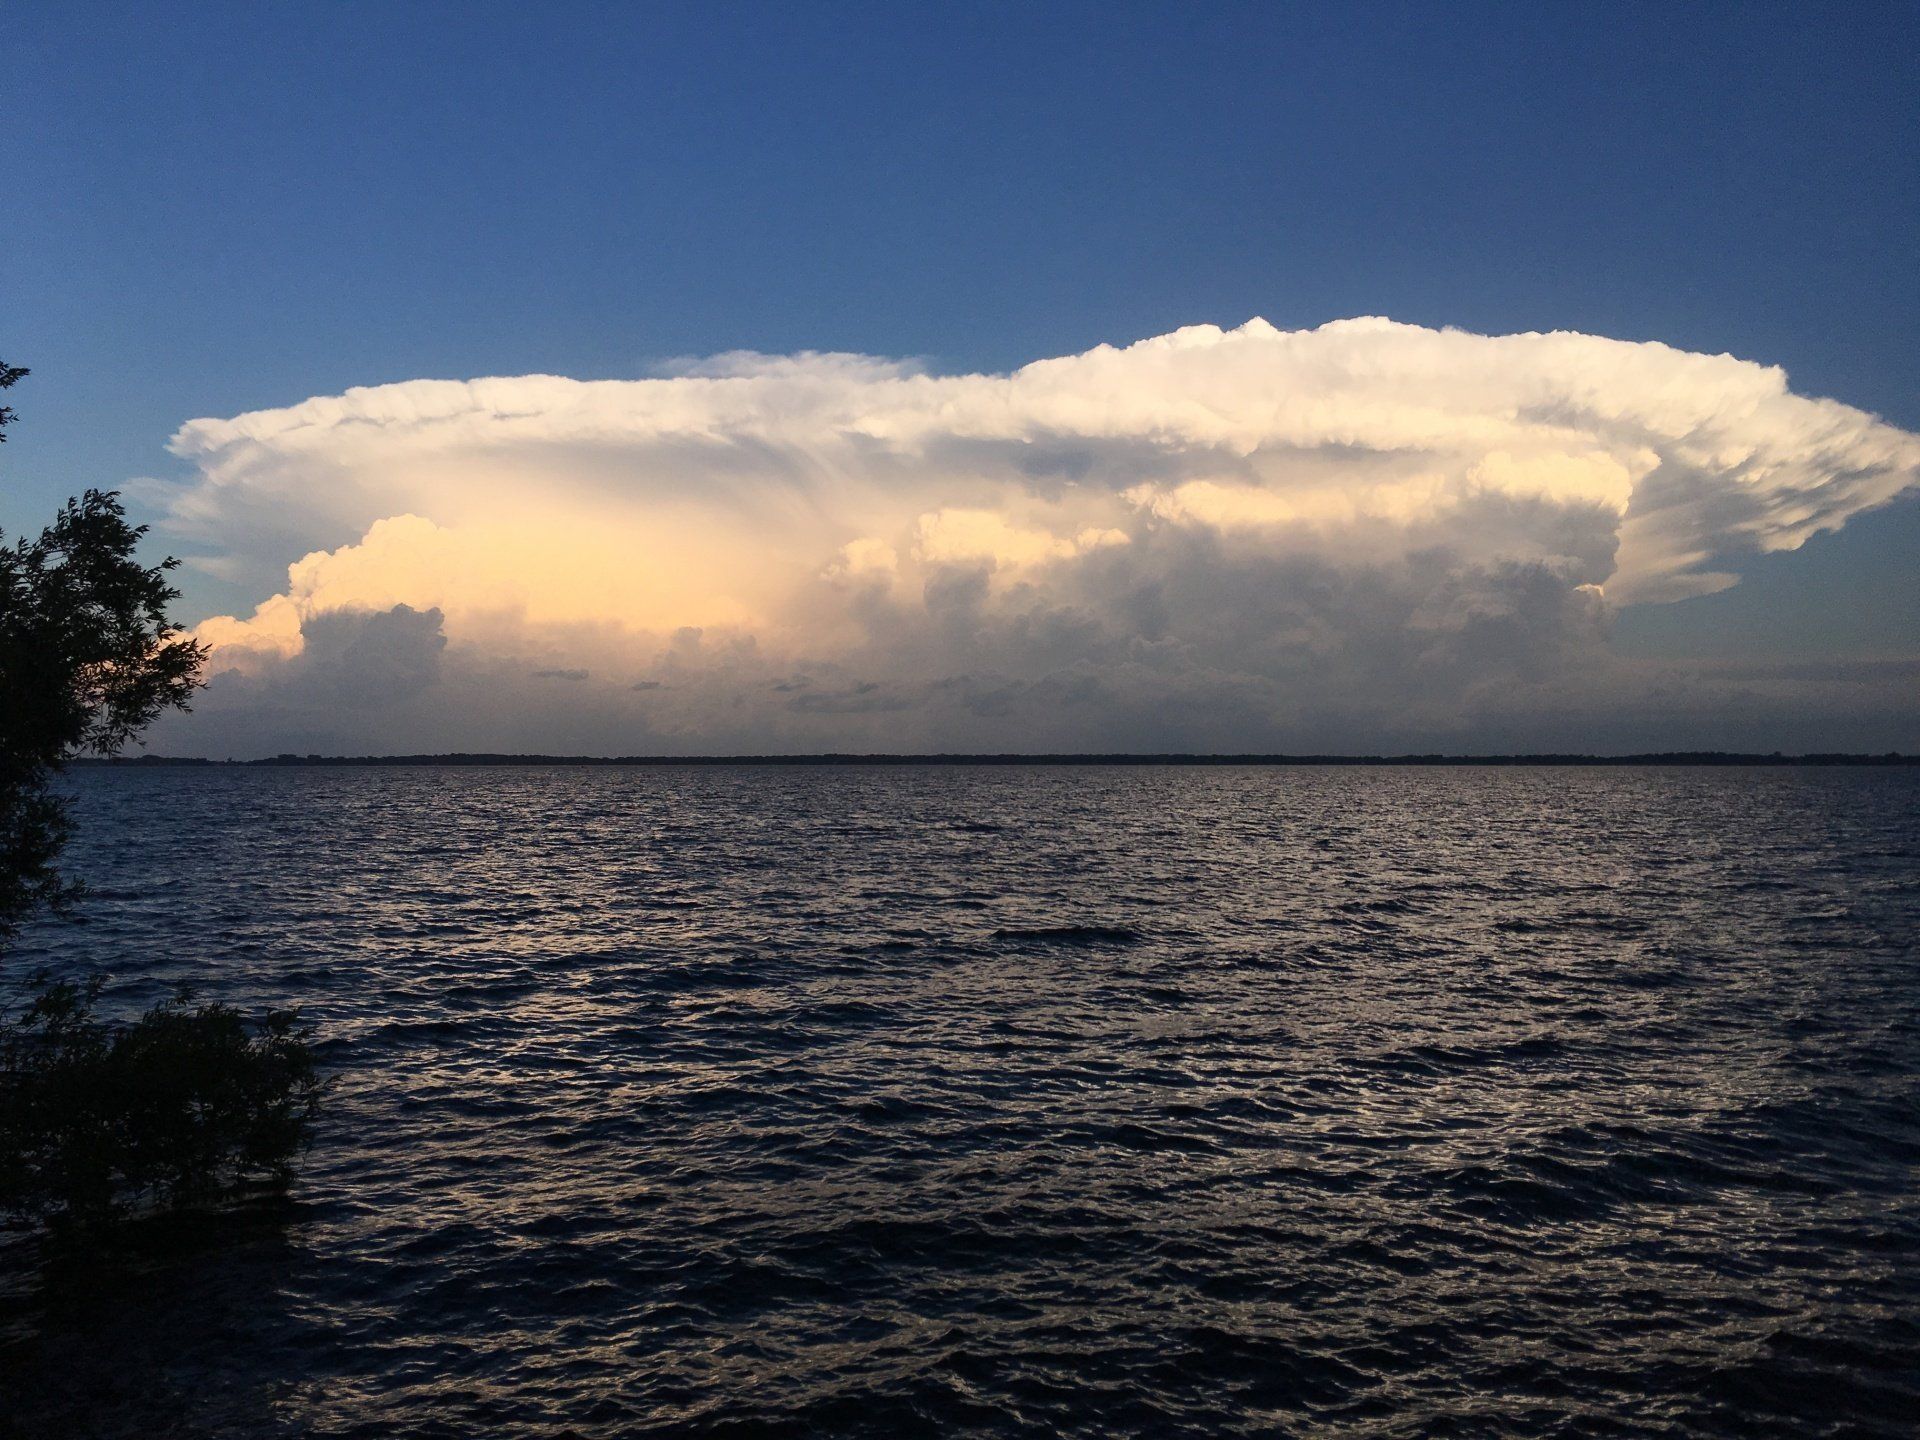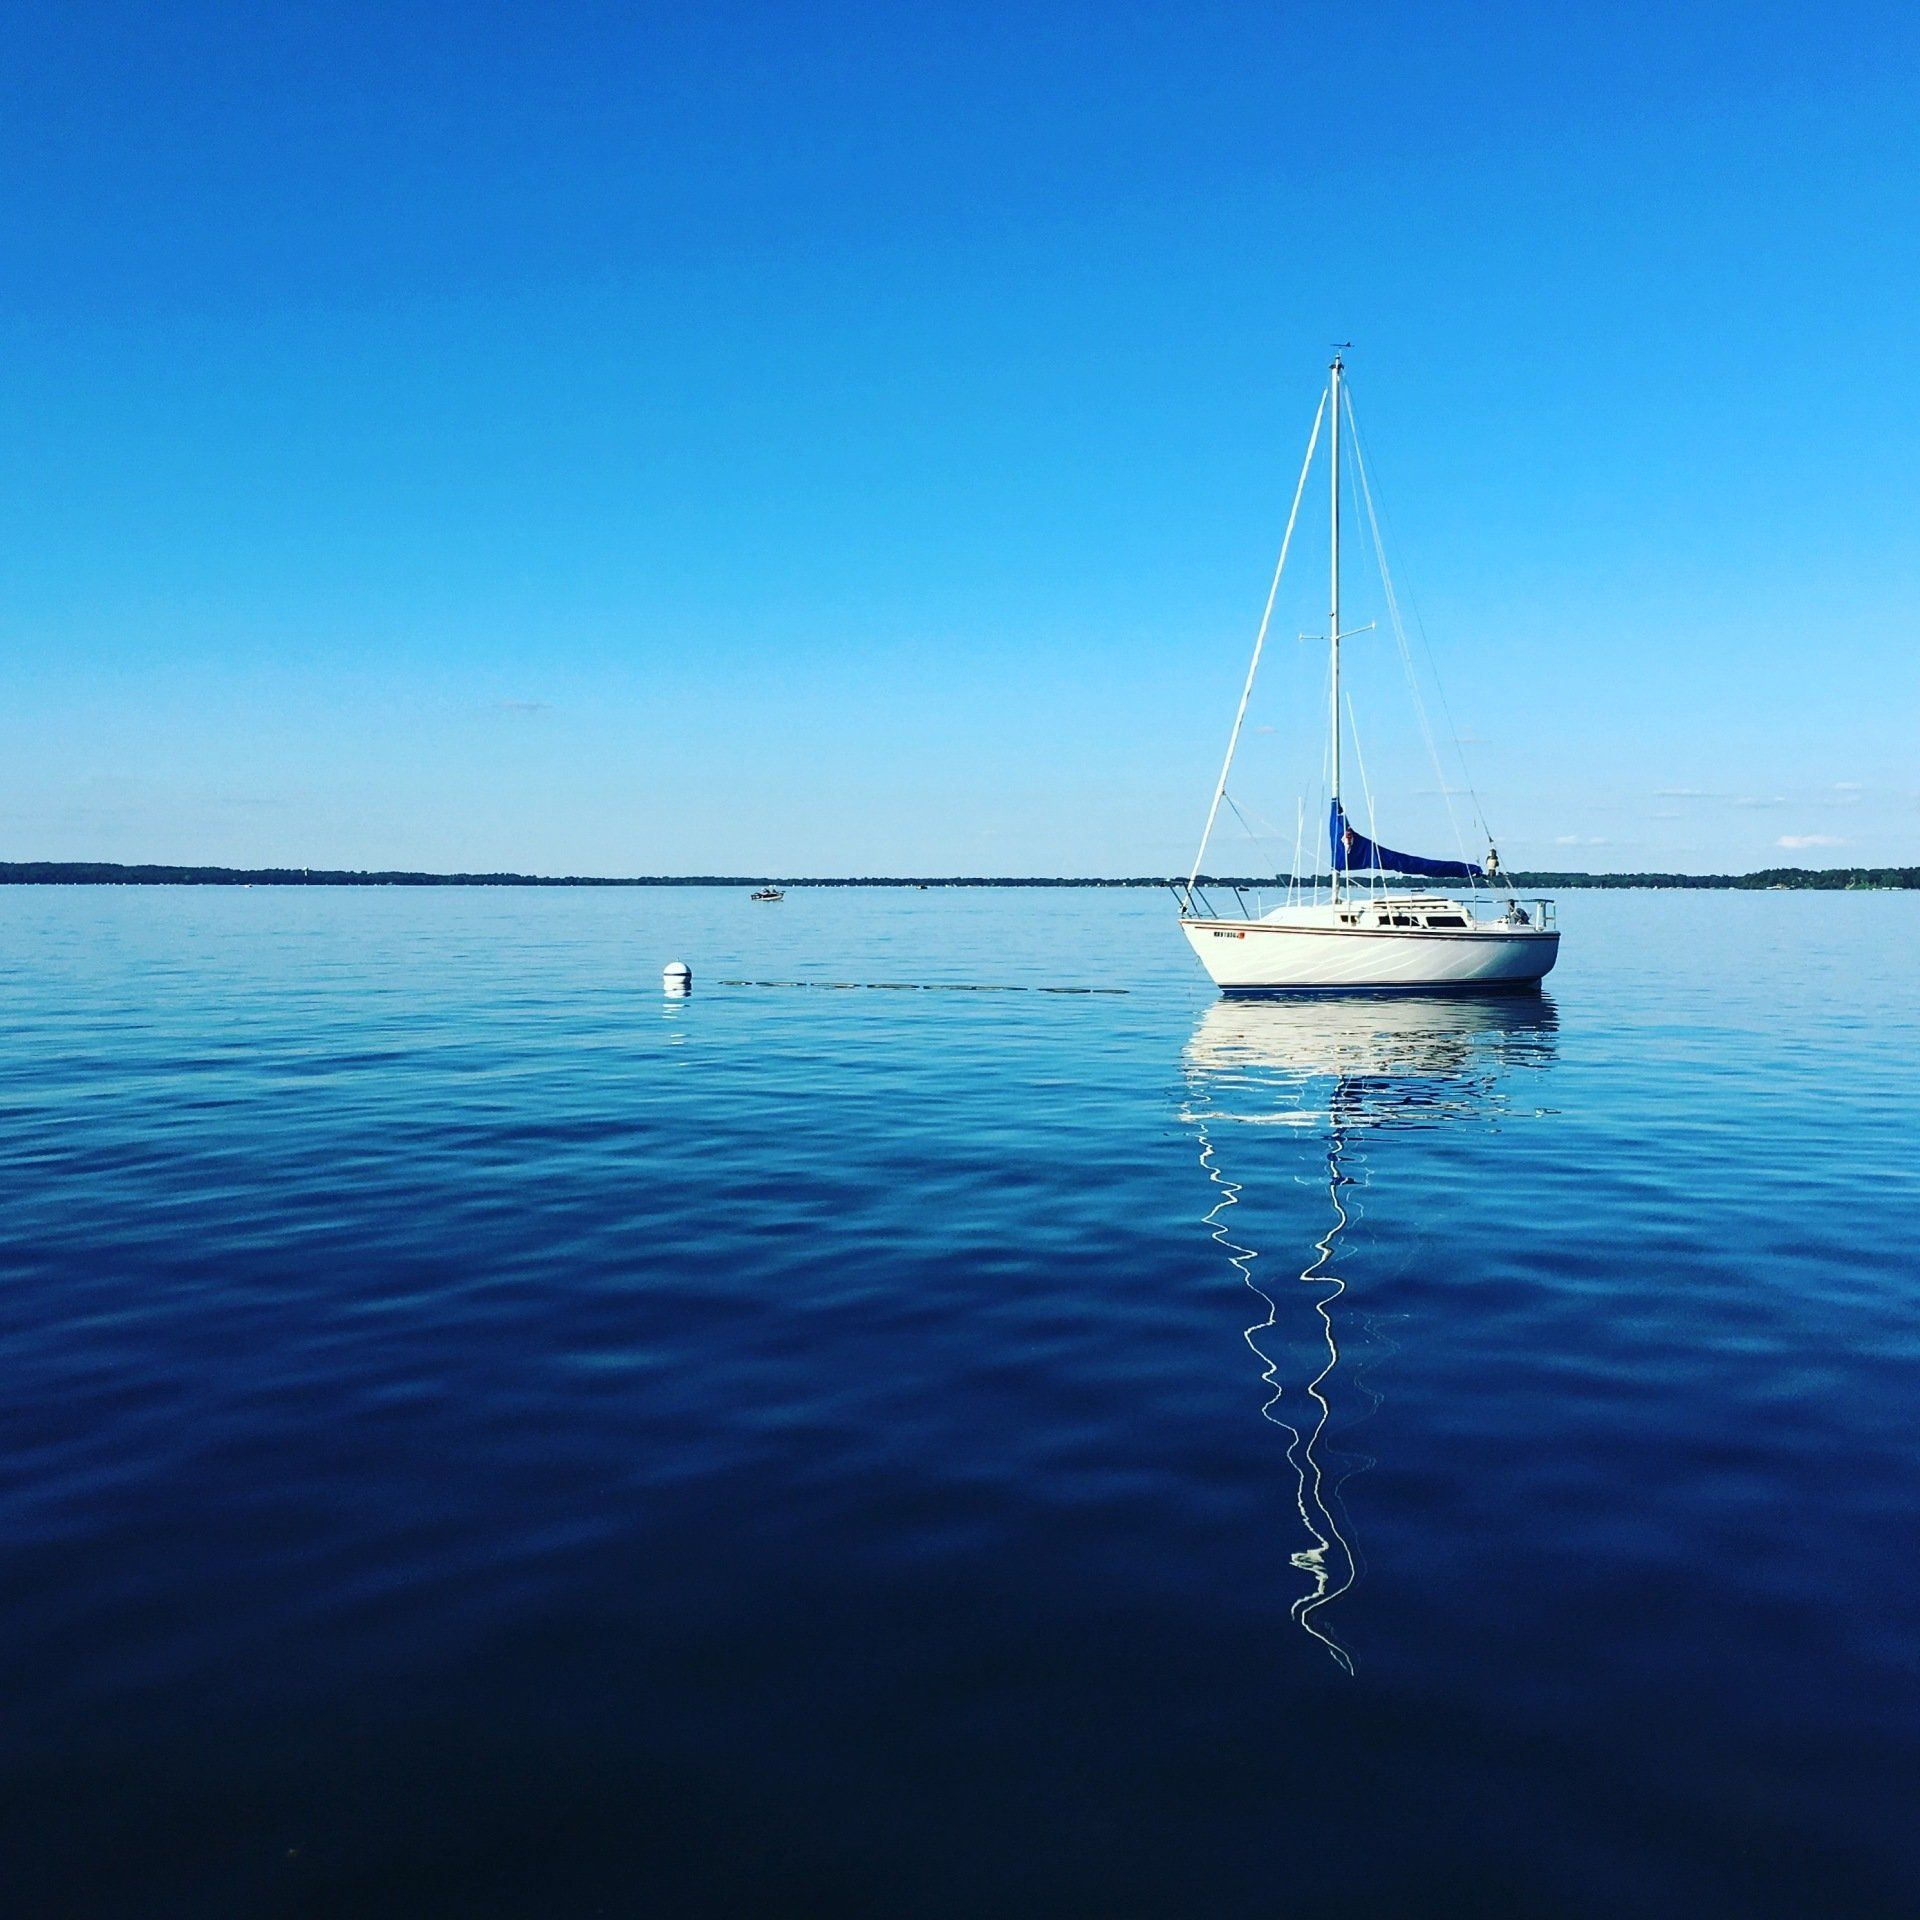
About the Lake
Stay in the know and learn about Green Lake
Lake News
- Impact of Zebra Mussels
Biol Invasions
https://doi.org/10.1007/s10530-021-02553-0(0123456789().,-volV)( 01234567 89().,-volV)
ORIGINAL PAPER
Impacts of zebra mussels (Dreissena polymorpha) on isotopic niche size and niche overlap among fish species in a mesotrophic lake
Alexandra L. Morrison . Mary A. Thelen . Sarah E. Howe . Kyle D. Zimmer . Brian R. Herwig . David F. Staples . Margaret C. McEachran
Received: 4 November 2020 / Accepted: 23 April 2021
The Author(s), under exclusive licence to Springer Nature Switzerland AG 2021
Abstract Zebra mussels (Dreissena polymorpha) filter feed phytoplankton and reduce available pelagic energy, potentially driving fish to use littoral energy sources in lakes. However, changes in food webs and energy flow in complex fish communities after zebra mussel establishment are poorly known. We assessed impacts of zebra mussels on fish littoral carbon use, trophic position, isotopic niche size, and isotopic niche overlap among individual fish species using d13C and d15N data collected before (2014) and after (2019)
Supplementary Information The online version contains supplementary material available at https://doi.org/10.1007/ s10530-021-02553-0.
A. L. Morrison (&) M. A. Thelen
S. E. Howe K. D. Zimmer
Biology Department, University of Saint Thomas, 2115 Summit Ave, Saint Paul, MN 55105, USA
e-mail: morr9903@stthomas.edu
B. R. Herwig
Fisheries Research, Minnesota Department of Natural Resources, 2114 Bemidji Avenue North, Bemidji, MN 56601, USA
D. F. Staples
Fisheries Research, Minnesota Department of Natural Resources, 500 Lafayette Road, St. Paul,
MN 55155, USA
M. C. McEachran
Department of Fisheries, Wildlife and Conservation Biology, University of Minnesota, 2003 Upper Buford Circle, St. Paul, MN 55108, USA
zebra mussel establishment in Lake Ida, MN. Isotope data were collected from 11 fish species, and from zooplankton and littoral invertebrates to estimate baseline isotope values. Mixing models were used to convert fish d13C and d15N into estimates of littoral carbon and trophic position, respectively. We tested whether trophic position, littoral carbon use, isotopic niche size, and isotopic niche overlap changed from 2014 to 2019 for each fish species. We found few effects on fish trophic position, but 10 out of 11 fish species increased littoral carbon use after zebra mussel establishment, with mean littoral carbon increasing from 43% before to 67% after establishment. Average isotopic niche size of individual species increased significantly (2.1-fold) post zebra mussels, and pair wise-niche overlap between species increased signif icantly (1.2-fold). These results indicate zebra mussels increase littoral energy dependence in the fish com munity, resulting in larger individual isotopic niches and increased isotopic niche overlap. These effects may increase interspecific competition among fish species and could ultimately result in reduced abun dance of species less able to utilize littoral energy sources.
Keywords Zebra mussels Fish community Littoral versus pelagic energy Interspecific competition Isotopic niche size Isotopic niche overlap
123
Introduction
Zebra mussels (Dreissena polymorpha) originated from Eastern Europe and were first detected in North America in the 1980s (Ricciardi et al. 1998). Multiple studies have assessed impacts of zebra mussels on lake ecosystems, and one of the most consistent effects is increased water clarity due to filter feeding on seston (Higgins and Vander Zanden 2010). Increased abun dance of submerged aquatic plants and periphyton is often a concomitant response due to increased water clarity and perhaps increased nutrient availability at the sediment interface due to zebra mussel biodeposits (Ozersky et al. 2012). The combined impacts of reduced phytoplankton and increased periphyton abundance represents a major shift in available energy from pelagic to littoral sources for invertebrate primary consumers (Higgins and Vander Zanden 2010). Several studies have examined impacts of this littoral shift on aquatic invertebrates, and have found increased reliance on littoral energy (Ozersky et al. 2012; Rennie et al. 2013; McEachran et al. 2018) and increased abundance of littoral invertebrates and decreased abundance of zooplankton (Higgins and Vander Zanden 2010; Ozersky et al. 2012; Rennie et al. 2013).
Given the overall restructuring of primary produc ers and primary consumers in aquatic ecosystems by zebra mussels, it follows that fish communities could also be impacted by zebra mussel colonization. Studies have shown that fish in north-temperate lakes fall along a continuum of relying mainly on pelagic energy to relying mainly on benthic and littoral sources (Vander Zanden and Vadeboncoeur 2002). However, a common finding is that once zebra mussels are introduced, multiple species of fish increase their reliance on littoral energy, shifting the continuum away from pelagic sources and towards littoral sources (Higgins and Vander Zanden 2010; Rennie et al. 2013; McEachran et al. 2018). Thus, increased availability of littoral energy at the expense of pelagic energy could have effects on competitive interactions among fish, and could shift competitive advantages to species better adapted to littoral habitats such as members of the Centrarchidae family (Higgins and Vander Zanden 2010; McEachran et al. 2018). Although studies have found that zebra mussels cause fish species to increase reliance on littoral energy, it is unknown whether this
123
A. L. Morrison et al.
shift increases niche overlap and the potential for stronger competitive interactions among fish species. The impact on competitive interactions is an important question, especially given some gamefish such as walleye (Sander vitreus) rely less on littoral energy than members of the Centrarchidae family (Vander Zanden and Vadeboncoeur 2002). Walleye may be less suited for both foraging in high-light conditions and foraging in littoral habitats relative to centrarchids like largemouth bass (Micropterus sal moides) (Robillard and Fox 2006). The planktivore cisco (Coregonus artedi) may also be especially sensitive to effects of zebra mussels on energy flow given their pelagic habitat requirements and heavy reliance on zooplankton prey (Ahrenstorff et al. 2013). Cisco are important diet components of gamefish such as walleye (Kaufman et al. 2009) and northern pike (Esox lucius) (Kennedy et al. 2018), and likely serve as an important link to sources of pelagic energy for piscivorous fish. As a species with cold water and high oxygen requirements, cisco are already sentinels for effects of climate change on fish communities (Jacob son et al. 2012). Climate and eutrophication effects, combined with reduced pelagic energy due to zebra mussels, may reduce abundance of cisco in moderately productive lakes, with subsequent impacts on pisci vores that feed on this species.
Stable isotopes ratios of carbon (d13C) and nitrogen (d15N) are a powerful tool for assessing impacts of zebra mussels on aquatic energy flow. Values of d13C can be used to determine the relative amounts of littoral versus pelagic energy (hereafter carbon) use due to littoral primary producers being more enriched in d13C relative to pelagic primary producers (France 1995; Hecky and Hesslein 1995). Moreover, d15N can estimate the trophic position of a consumer due to the average increase of 3.4% per trophic transfer (Post 2002). d13C and d15N can be used together in mixing models to obtain more precise estimates of littoral carbon use and trophic position than would otherwise be obtainable without mixing models (Post 2002), and the transformation from raw isotopic values to dietary proportions and trophic position facilitates a mean ingful analysis of the isotopic niche of fish species (Newsome et al. 2007). Subsequent analyses can then test whether zebra mussels reduce the isotopic niche size of individual species or the community of sampled species (Jackson et al. 2011) and if zebra mussels increase isotopic niche overlap among fish
Impacts of zebra mussels (Dreissena polymorpha) on isotopic niche size
species in a lake (Swanson et al. 2015). We recognize that isotopic niches are not the same as trophic niches, though they should be highly correlated (Jackson et al. 2011). Isotopic niches are based on ecologically relevant data and can thus be used to estimate key characteristics of a species niche in the traditional sense of Hutchinson’s hypervolume (Newsome et al. 2007; Jackson et al. 2011). Although several studies have documented increased use of littoral carbon in response to zebra mussels (Ozersky et al. 2012; Rennie et al. 2013), and some have found impacts on trophic position (McEachran et al. 2018), zebra mussel impacts on isotopic niche size of individual fish species and the fish community, as well isotopic niche overlap among species, is less understood. Moreover, many studies on zebra mussels have been conducted in large, deeper north temperate lakes with higher reliance on pelagic production (MacIsaac 1996; Ozersky et al. 2012; Rennie et al. 2013; Armenio et al. 2016). Fewer studies exist for smaller, shallower lakes with more balanced littoral and pelagic produc tion where community shifts might be more subtle (Irwin et al. 2016; McEachran et al. 2018). Finally, logistics limit some studies to comparing lakes with zebra mussels to lakes without (McEachran et al. 2018), limiting their ability to fully capture zebra mussel impacts versus natural differences between lakes. In this study we use isotope data collected in a moderately sized mesotrophic lake before and after establishment of zebra mussels to assess impacts on (1) fish energy use and trophic position, (2) fish species and sampled community isotopic niche size, and (3) isotopic niche overlap among fish species.
Methods and materials
We studied Lake Ida, a lake with 40% littoral area (water depth\4.6 m) in Minnesota, USA (46.0002 N, 95.4082 W). Lake Ida was previously sampled for stable isotopes by McEachran et al. (2018) in 2013 and 2014, and zebra mussels were first detected in the lake in 2014 when two adults were found during extensive underwater surveying. By 2019, Ida was fully infested with zebra mussels ubiquitous throughout the entire lake. Lake-wide impacts on water clarity and phyto plankton abundance were pronounced, with citizen data (https://www.rmbel.info/data/) showing chloro phyll a declined from 4.4 lg L-1 during 2010–2013
(mesotrophic status) to 2.1 lg L-1 during 2016–2019 (oligotrophic status), while Secchi depth increased from 3.2 to 5.4 m during the same time periods. Thus, we used data collected by McEachran et al. (2018) in 2014 as ‘‘before zebra mussel establishment’’ (here after referred to as ‘‘Before’’) data, and data we col lected in 2019 as the ‘‘after zebra mussel establishment’’ (‘‘After’’) data. Methods described below for 2019 are identical to those used by McEa chran et al. (2018), allowing us to test for significant changes in isotope characteristics between Before and After periods.
All After data were collected during summer 2019, with fish sampled in August and aquatic invertebrates and zooplankton sampled during May and late July. Our goal for sample collection was to match the invertebrate and fish taxa collected and analyzed by McEachran et al. (2018). Therefore, we focused on black crappie (Pomoxis nigromaculatus), bluegill (Lepomis macrochirus), largemouth bass, northern pike, pumpkinseed (Lepomis gibbosus), rock bass (Ambloplites rupestris), smallmouth bass (Mi cropterus dolomieu), walleye, yellow bullhead (Ameiurus natalis), yellow perch (Perca flavescens), and cisco for fish taxa, and used the same littoral invertebrates as McEachran et al. (2018) (Trichoptera, Chironomidae, Hyalella, and Ephemeroptera) to char acterize the littoral baseline. Fish were collected using trap nets, gill nets, beach seines, and boat-mounted electrofishing equipment. We collected and froze dorsal muscle tissue from larger fish in the field, and we froze the entire body of smaller fish and subse quently removed dorsal muscle tissue later in the lab. Littoral invertebrates were collected from multiple locations using dip nets and by rinsing submerged vegetation and rocks. Zooplankton were used as pelagic primary consumers and samples were col lected in three locations on each date by towing a 153 lm Birge closing net through both the epilimnion (top of metalimnion to surface) and hypolimnion (1 m from lake bottom to bottom of metalimnion). Zoo plankton and littoral invertebrates were kept separated and rinsed into 0.7 lm pre filtered lake water, where they were kept for at least two hours to allow them to clear gut contents. In the lab, littoral invertebrates were identified, rinsed with nanopure water, and frozen. Zooplankton were rinsed with nanopure water using a 250 lm mesh, filtered onto a precombusted GF/C filter, wetted with 1% HCL to remove
123
particulate inorganic carbon, rinsed with nanopure, and frozen.
All tissue and filter samples were dried to a constant weight at 60 C, and fish and invertebrate samples were then ground into a homogenous sample. Samples were wrapped in tin and analyzed for d13C and d15N by the University of California Davis Stable Isotope Facility. Fish and invertebrate tissue were analyzed using a PDZ Europa ANCA-GSL elemental analyzer interfaced to a PDZ Europa 20–20 isotope ratio mass spectrometer, while zooplankton tissue was analyzed using an Elementar Vario EL Cube or Micro Cube elemental analyzer interfaced to a PDA Europa 20–20 isotope ratio mass spectrometer. Precision (1 SD) was ± 0.2% (d13C) and ± 0.3% (d15N) in 2014, and ± 0.04% (d13C) and ± 0.11% (d15N) in 2019.
d13C estimates can be biased by lipids naturally depleted in d13C relative to other tissue (Smyntek et al. 2007). We therefore applied lipid corrections using regression Eq. 3 from Post et al. (2007) to all samples with a C: N value greater than 3.25. Hereafter all d13C values are lipid corrected. We then used the average d13C and d15N values from all of our zooplankton samples as the baseline estimate for the pelagic food web, and the mean d13C and d15N from all littoral macroinvertebrates as the estimate of the littoral baseline. Baseline values for d13C in 2014 were slightly more enriched for both zooplankton and littoral invertebrates, while d15N values changed very little in both habitats (Table 1). We used zooplankton
A. L. Morrison et al.
for our pelagic baseline instead of longer-lived mussels given McEachran et al. (2018) also used zooplankton.
Equations described in Post (2002) and McCutchan et al. (2003) were then used to convert raw d13C and d15N values into proportional littoral carbon in diets and trophic position, respectively. Briefly, proportion littoral carbon (a) is estimated as: a = (d13Cpelagic base-
- d13Csecondary consumer ? Dtsc)/(d13Cpelagic base- - d13Clittoral base). d13Cpelagic base represents the average d13C of zooplankton, d13Csecondary consumer represents the d13C of an individual fish, d13Clittoral base represents the average d13C of littoral invertebrate primary consumers, and Dtsc represents the trophic fractionation of d13C multiplied by the trophic position of individual fish. We used 0.4% as the trophic fractionation of d13C based on Post (2002). Trophic position was estimated as: trophic posi tion = k ? (d15Nsecondary consumer – [d15Nlittoral base * a ? d15Npelagic base * (1- a)]) / DN, and we set k = 1 so that estimates are for trophic levels above primary consumers. d15Nsecondary consumer represents the d15N of an individual fish, d15Nlittoral base represents the average d15N of littoral aquatic invertebrate primary consumers, d15Npelagic base represents the average d15N for zooplankton, DN represents the trophic fractiona tion of d15N, and a represents the proportion littoral carbon from the previous equation. We used 3.4% for the trophic fractionation of d15N (Post 2002). The equations share the terms trophic position and a, and
Table 1 Average d13C and d15N in littoral baseline, pelagic baselines and in the 11 species of fish in both 2014 and 2019 (± 1SD). Numbers following
taxonomic group are sample sizes for 2014 and 2019
123
Taxonomic group 2014 2019 d15N d13C d15N d13C
Littoral primary consumers (23, 24) 4.5 (2.2) - 20.2 (2.7) 4.8 (0.8) - 22.2 (1.2) Pelagic primary consumers (10,12) 7.9 (0.9) - 26.7 (0.8) 7.7 (1.3) - 27.9 (0.7) Black crappie (7, 7) 12.8 (0.5) - 23.9 (0.2) 12.2 (0.9) - 23.9 (0.8) Bluegill (6, 7) 11.7 (1.0) - 23.3 (0.3) 9.9 (0.9) - 22.2 (0.4) Largemouth bass (7, 30) 13.3 (0.8) - 23.2 (0.8) 12.8 (0.8) - 22.6 (0.8) Northern Pike (6, 30) 12.9 (1.0) - 22.8 (0.5) 12.7 (0.5) - 23.2 (0.7) Pumpkinseed (7, 7) 10.8 (1.3) - 23.0 (0.9) 9.9 (1.0) - 23.3 (1.0) Rock bass (7, 7) 12.4 (0.6) - 21.5 (1.2) 11.6 (0.4) - 22.6 (0.8) Smallmouth bass (7, 15) 12.5 (0.6) - 22.1 (0.5) 12.6 (0.7) - 23.0 (0.9) Cisco (7, 15) 11.6 (0.4) - 26.6 (0.2) 11.4 (0.4) - 27.2 (0.3) Walleye (10, 30) 14.2 (0.4) - 23.3 (0.6) 13.4 (0.6) - 23.3 (0.6) Yellow bullhead (7, 7) 12.0 (1.2) - 22.6 (0.6) 12.0 (0.6) - 23.0 (1.1) Yellow perch (8, 20) 11.2 (0.5) - 24.0 (1.3) 11.6 (0.6) - 23.2 (1.3)
Impacts of zebra mussels (Dreissena polymorpha) on isotopic niche size
the equations are fit in an iterative process until parameter estimates stabilize (Post 2002). We used three analytical approaches to test whether the following variables showed significant change from the Before to After establishment periods: (1) littoral carbon and trophic position of individual species and the sampled fish community, (2) isotopic niche size of the sampled fish community and individual fish species, and (3) isotopic niche overlap among individual species. First we tested for signif icant effects of zebra mussels on trophic position and littoral carbon use in individual fish species using ANCOVA with year (Before versus After), fish length, and year*length interaction as possible explanatory variables. If the interaction was not significant we dropped the term and tested for year and length effects only. Fish length is an important factor to consider since fish d13C and d15N can change as they grow and increase length due to ontogenetic habitat and diet shifts. We tested for a community-wide change in littoral carbon use and trophic position using a linear mixed-effects model with fish species as random effect and year as a fixed effect. Length, littoral carbon, and trophic position were log transformed to equalize variance and normalize residuals. All anal yses, including those described above, were conducted using JMP version 15 (SAS 2019), unless noted otherwise.
We secondly tested for significant change from Before to After in the size of isotopic niche space for individual species based on their standard ellipse area (SEAB method in Jackson et al. 2011) and also tested for change in the size of the entire sampled community isotopic niche space based on convex hulls (Jackson et al. 2011). Standard ellipse areas and convex hulls were estimated from littoral carbon use and trophic position using the R program SIBER (Jackson et al. 2011). We graphically evaluated changes in isotopic niche size of individual species by estimating standard ellipse area in both years and assessing overlap of 85% credible intervals for each year-size estimate. Credible intervals are based on the posterior distributions of estimates, which can be directly transformed to the distribution of the difference between 2 parameters. As such, non-overlapping 85% credible intervals infer an approximate 97% probability that the absolute difference between the 2 parameters is[ 0 (large imbalances in posterior variances can have a small effect). We also tested whether average individual
species isotopic niche size changed from the Before to After period by testing whether the average difference between time periods (After-Before) differed from zero across the 11 species. For our community scale test, the After data set had more samples of walleye, northern pike, and largemouth bass compared to the Before period, potentially confounding sample com position with zebra mussel effects on isotopic niche size at the community scale. Thus, we modified our SIBER analysis at the community scale with a boot strapping procedure where 10 individuals were ran domly drawn with replacement from each species in each year to estimate the convex hull using SIBER, and this procedure was repeated 1000-fold to develop credible intervals not influenced by sample composi tion. We then used 85% credible intervals of Before and After community isotopic niche size to test whether the community isotopic niche space changed after zebra mussel establishment. Cisco are the only exclusively pelagic species in our analysis, and they may be an important link to pelagic energy for piscivorous fish. Their pelagic reliance may also cause cisco to have a disproportionately large influence on the overall isotopic niche space of a fish community. Thus, we assessed the relative importance of cisco on the isotopic niche size of the fish community by estimating the convex hull in the Before and After periods both with and without cisco in the analysis.
Finally, we assessed the change in potential inter specific competition from Before to After among fish species by estimating the amount of overlap in isotopic niche space between species in both Before and After years using the R program NicheRover (Swanson et al. 2015). This analysis estimates both directions of overlap between each species pair (A on B, B on A), and the two estimates can be asymmetrical. We used the estimated overlap and 85% credible interval for each pairwise-species estimate in Before and After years to infer if isotopic niche overlap changed from before to after zebra mussels. We also tested whether isotopic niche overlap increased on average across the fish community by finding the difference in median percent isotopic niche overlap between years (After Before) for each species pair, and then used a mixed model with species as a random effect to test whether the intercept (median percent change) differed from zero. Cisco showed virtually no overlap with other fish species in our analysis (discussed below), and so they
123
were not used in our test for significant change in isotopic niche overlap across species.
Results
Objective 1: Littoral carbon use and trophic position
Results showed 10 of 11 species increased reliance on littoral carbon in the After period, with smallmouth bass as the only species showing no length, year, or interaction effect (Fig. 1, 2; Supplementary Table S1). Black crappie, bluegill, pumpkinseed, yellow perch, yellow bullhead, northern pike, and cisco all showed significant year effects with higher littoral carbon reliance after establishment, but no length or interac tion effect (Fig. 1, 2). Rock bass, largemouth bass, and walleye all had significant length and year effects, with all three species consuming more littoral carbon after establishment and in larger fish (Fig. 2). None of the 11 species showed a length*year interaction (Table S1). Effect size of zebra mussels on littoral carbon was large for both piscivorous and non piscivorous fish species, as on average walleye increased littoral carbon use from 38 to 66%, while bluegills increased from 43 to 91%. The exception to the pattern of large increase in littoral carbon reliance was with cisco, where despite a statistically significant increase in the After period, littoral carbon use increased from 0% to just 4%, perhaps due to cisco’s oxythermal and behavioral constraints that prevent them from increasing consumption of littoral carbon. Our mixed-model analysis with species as a random effect indicated littoral carbon use averaged across species increased in the After period (P \0.001) (Table S2), shifting from 43 to 67% littoral carbon in the Before to After period, respectively.
Results for trophic position were far less pro nounced, as only 2 of 11 species increased trophic position in the After period. Smallmouth bass and yellow perch had year and length effects, with both species showing an increase in trophic position in the After period and with increasing fish length but no interaction (Fig. 3, Table S3). Black crappie and bluegill both showed length*year interactions, but in both cases results appear to be driven by a single data point in the 2014 data (Fig. 3, Table S3). Rock bass also showed a significant year effect with no length or
123
A. L. Morrison et al.
interaction effect, but the pattern was a decrease in trophic position in the After period, while cisco showed no year, length, or interaction effect (Fig. 3, Table S3). Pumpkinseed, largemouth bass, northern pike, walleye, and yellow bullhead all showed signif icant length effects where each species’ trophic position increased with fish size, but none showed a year or interaction effect (Fig. 4, Table S3). Results for the mixed model with species as a random effect showed an increase in trophic position averaged across species (P = 0.013) (Table S2), but the effect size was much smaller than that observed for littoral carbon, as trophic position increased from 1.73 to just 1.80 trophic levels above primary consumers from the Before to After periods.
Objective 2: Isotopic niche size
Mean trophic position and littoral carbon use across species showed consistent increased use of littoral carbon across species (Fig. 5a). Analysis of commu nity isotopic niche size with cisco included showed no difference in isotopic niche size between time periods based on credible intervals, while excluding pelagic cisco resulted in much smaller community isotopic niche size that also did not differ between time periods (Fig. 5b). However, this analysis illustrates the impor tance of cisco for tapping pelagic energy for the fish community and increasing the size of the isotopic community niche, as non-overlapping credible inter vals indicated community isotopic niche size with cisco included was significantly larger in both the Before (1.8-fold larger) and After (2.5-fold larger) periods compared to the same time period with cisco excluded (Fig. 5b). Cisco drove the larger isotopic niche in both time periods because most other species relied more heavily on littoral carbon, while cisco remained almost exclusively pelagic during both time periods (Fig. 5a). This caused the estimated convex hull area to ‘‘stretch’’ across a wider range of littoral carbon use when cisco were included (Fig. 5c) com pared to when they were excluded (Fig. 5d), causing a larger estimate of community isotopic niche size with cisco. When cisco are removed from the analysis, neither Before nor After periods are stretched along the littoral carbon axis, resulting in smaller but similar isotopic niche sizes between periods (Fig. 5d). With cisco excluded, the primary difference between time periods is the After community isotopic niche shifted
Impacts of zebra mussels (Dreissena polymorpha) on isotopic niche size
- Assessing Yellow Perch
STUDY 654: Assessing Yellow Perch populations with experimental sampling gears
Date: 4/1/2019 – 3/31/2020
Need
Minnesota Department of Natural Resources (MN DNR) statewide fisheries survey data has shown a decline in Yellow Perch standard survey gill net and trap net catch (Bethke and Staples 2015), but the cause of this decline is unknown (B. Bethke, unpublished data). Because some Minnesota Yellow Perch populations may reach sexual maturity before standard sampling gears are effective (MN DNR, unpublished data), it is currently unclear whether the decline in Yellow Perch catch rates in Minnesota is reflective of an overall reduction in abundance, increased mortality on certain size classes, or a shift in size structure causing changes in mean catchability. Determining robust sampling methods and identifying key population metrics for Yellow Perch is important for managing fisheries dependent on this species.
This project proposes to use experimental sampling methods in combination with standard gill nets to sample a range of Yellow Perch sizes in lakes across the state and to develop protocols for evaluating growth, sex, and maturity. Results from this project will provide guidance for managers wanting to more effectively sample Yellow Perch and represents a first step towards developing metrics that can be used in future work to evaluate factors that influence size distributions of populations in Minnesota.
Objectives
1. Compare Yellow Perch size selectivity, catch variability, and labor efficiency of experimental sampling gears including small mesh forage gill nets and electrofishing.
2. Survey Yellow Perch growth, sex, and maturity from a range of lakes across Minnesota. Contents
Jobs 1, 2, 3, and 4 were active during this grant and performance reports are attached. JOB 654.1: Lake and gear selection, method protocol development.
JOB 654.2: Evaluate sampling gears including size selectivity, sex and maturity ratios, and labor efficiency per catch.
JOB 654.3: Estimate Yellow Perch age, growth, and maturity by sex across lakes.
JOB 654.4: Dissemination of findings.
Prepared by: Beth Holbrook and Bethany Bethke, Fisheries Research Scientists
JOB 654.1 Lake and gear selection, method protocol development.
Objectives
1. Identify lakes to be sampled in this study using standard gill net catch rates, geographic region, lake size, depth, and productivity to represent a range of Yellow Perch populations.
2. Develop criteria for evaluating Yellow Perch sex and maturity, create tutorials, and provide training to Area staff.
3. Develop sampling methods for targeting Yellow Perch using experimental small mesh gill nets and electrofishing transects.
4. Work with Area staff to identify when each lake will be sampled, procure sampling gear, and identify additional field support that may be needed.
5. Develop subsampling protocols for electrofishing and gill-net catches to estimate the number of Yellow Perch that should be evaluated for length, weight, sex, and maturity including by mesh when applicable.
Procedures
As part of Job 654.1, we planned to work with collaborating Areas during Segment 50 to arrange a sampling schedule for August 2020. Unfortunately, experimental Yellow Perch sampling was delayed a year due to Covid 19. To maintain consistency in maturity assessments and subsampling protocols, we have relied on in-person trainings that were not possible during the pandemic. However, three Areas that had previously been trained on the protocols decided to sample in Autumn 2020 while utilizing Covid-19 mitigation procedures, including electrofishing with only one netter, maintaining physical distance, and using face coverings while picking fine mesh gill nets and working up fish. We worked with these three Areas to provide equipment and to transfer samples
for age estimation.
We also planned to develop statistical methods to account for length-based subsampling bias during Segment 50. Statistical methods are being developed for fine mesh gill nets to apply information from subsampled fish to the total catch from each mesh, including accounting for length-based subsampling bias in age estimation. To ensure we have enough information to account for potential biases, we continued to evaluate subsampling protocols, including whether target sample sizes for both electrofishing and small mesh gill nets are adequate. Evaluation of subsampling methodology will be used to inform procedures for future data collection, including the number of fish in each length category that should be evaluated for length, weight, age, and sex.
We have continued to prioritize open communication with participating Areas throughout the project including communicating project timeline changes due to Covid-19.
Findings
Nearly all field sampling was postponed until Autumn 2021, with the exception of three Areas (Brainerd, Hutchinson, and Park Rapids) who sampled seven lakes in Autumn 2020. These seven lakes including assessing five new lakes and reassessing two lakes that were previously sampled. We provided fine mesh gill nets and equipment to Areas needing replacement equipment.
Statistical methods to account for length-based subsampling bias and to impute ages for unevaluated fish are currently being evaluated. Methods that are being assessed include modeling age distributions using statistical models, applying age-length keys, applying resampling methods, and using backcalculations to increase sample sizes (Campana 1990; Niewinski and Ferreri 1999; Blackwell and Kaufman 2012; Ashworth et al. 2017).
We used emails and an intranet site to communicate changes in project plans due to Covid-19. Sampling protocols were also posted on an intranet site for Areas that conducted special sampling in 2020. We are continuing to investigate tools for effectively communicating project objectives, procedures, and updates. A survey is currently being drafted to determine sampling plans for Autumn 2021, including Area needs for gear replacement, training, and field sampling assistance.
Recommendations
Continue Job 654.1.
JOB 654.2 Evaluate sampling gears including size selectivity, sex and maturity ratios, and labor efficiency per catch.
Objective
Compare Yellow Perch population metrics sampled with multiple experimental gears to determine tradeoffs in data utility and effort collected.
Procedures
As part of Job 654.2, we planned to continue collecting field data during Segment 50, including recording information on length, sex, and maturity of Yellow Perch collected with experimental gears. However, the second year of planned Yellow Perch experimental sampling was delayed one year due to Covid-19, with the exception of three Areas who conducted special sampling in August 2020. For the seven lakes sampled in 2020, both sets of experimental gear were used including fine mesh gill nets and boat electrofishing.
Findings
The three Areas that conducted special sampling in August 2020 followed protocols for sampling Yellow Perch, including the use of both experimental gears, fine mesh gill nets and boat electrofishing. However, one Area had a difficult time capturing the target sample size of Yellow Perch in four lakes using boat electrofishing (Belle, Collingwood, Marion, and Minnie-Belle). Subsampling protocols were followed that included recording information on fish counts, lengths, weights, sex, maturity status, and collecting otoliths for age estimation. Timing of sampling varied in each lake depending on geographic area, weather, water temperature, and workload schedules. All experimental surveys in 2020 were conducted during the month of September.
The total number of Yellow Perch sampled with fine mesh gill nets on the seven lakes sampled in 2020 was 8,255 (range = 437 - 2,215, median per lake = 708). Of the fish sampled with fine mesh gill nets, 5,377 were measured (median per lake = 658) and 3,690 were evaluated for sex and maturity (median per lake = 209). Electrofishing samples from Autumn 2020 have not yet been processed, except for Lake Kabekona.
Recommendations
Continue Job 654.2.
Job 654.3 Estimate Yellow Perch age, growth, and maturity by sex across lakes. Objective
Quantify Yellow Perch age, growth, and maturity metrics from populations representing a range of lakes across Minnesota varying in nutrient availability (productivity), surface area, depth, and geographic location.
Procedures
As part of Job 654.3 during Segment 50, we continued taking digital images and estimating ages of structures sampled during 2019 and 2020. Age was evaluated for Yellow Perch using otoliths, which have the highest level of agreement between independent readers and the lowest levels of variability (Niewinski and Ferreri 1999; Vandergoot et al. 2008). Digital images were taken of Yellow Perch otoliths that were collected using experimental sampling and standard lake surveys. Otolith images allowed for multiple readers to estimate ages and to be able to jointly re-evaluate images in the case of disagreement.
We also planned to begin making between-lake comparisons of length at maturity, age at maturity, and growth. Yellow Perch estimates of length at 50% maturity were calculated individually for each sex for each lake sampled in 2020 and compared to estimates of lakes previously sampled in 2019. Age at maturity and growth have not yet been evaluated because we continue to estimate ages and evaluate statistical methods to account for length
based subsampling bias.
Findings
All Yellow Perch otoliths that were imaged during Segment 49 and evaluated by a single reader were reevaluated by a second reader (n=3,775). If there was disagreement between age estimates, otoliths were re-evaluated, cracked, burned, and re-imaged until two readers mutually agreed upon an age. Additionally, Yellow Perch digital images were taken of otoliths collected during standard lake surveys (n=470), including Bemidji, Big Sandy, Big Stone, Green, Hill and Kabekona. Images were evaluated by two second readers and any disagreement between age estimates were resolved using the method described above. Initial agreement in age estimates between readers was > 93%.
The age and length distribution of female Yellow Perch varied by lake, after removing age estimates for length bins where fewer than two fish were measured (Table 1). For example, the average age of Yellow Perch in the 140 mm length bin, or the size at which Yellow Perch become susceptible standard nets, ranged from 1.0 yr to 3.7 yrs. The age distributions in some lakes (Green, Gull, Hill, and Pike) suggested that slow growth might be a factor contributing to a truncated size structure. Additionally, there was a wide range of maximum average female Yellow Perch ages per 10-mm length bin, ranging from 2 yrs in Clearwater to 10.7 yrs in Cloquet (Table 1).
The average age and length distributions of male Yellow Perch also varied by lake (Table 2). Males did not typically grow as large or live as long as females (Table 2), although the maximum age for females was correlated with the maximum age for males within lakes (R2=0.52, F=19.67, p=0.0003).
We analyzed length at maturity (L50) for female and male Yellow Perch sampled in Autumn 2020 using logistic regression. In one lake (Marion), we were unable to calculate L50 for either sex because all females and males that were evaluated were already mature. Female L50 for all lakes sampled in 2020 were compared with lakes previously sampled in 2019 (Figure 2). In the two lakes that were sampled with fine mesh gill nets in both years, Gull Lake had a significantly longer length at maturity in 2020 compared to 2019, but Pelican Lake had no significant difference in estimates between years (Figure 2). Age and growth of maturity have not yet been calculated and compared between lakes.
Recommendations
Continue Job 654.3.
Job 654.4 Dissemination of findings.
Objective
Prepare reports and oral presentations and disseminate project findings.
Procedures
Preliminary data will be incorporated into progress reports that will be submitted annually. Oral presentations will be presented at scientific meetings (i.e., Minnesota Chapter AFS Annual Meeting) and other venues. Final reports will be written and manuscript(s) will be prepared for publication.
Findings
Preliminary data were summarized and presented at the 2021 Midwest Fish and Wildlife Conference in the symposium, Effects of System Change on North American Percid Populations. Additionally, a manuscript titled “Estimating life history metrics of Minnesota’s changing Yellow Perch populations” was prepared and submitted to the North American Journal of Fisheries Management for peer review as part of a special issue (draft available upon request). A presentation was also given to the Leech Lake Public Advisory group.
This document fulfills requirements for an annual progress report.
Recommendations
Continue Job 654.4.
References
Ashworth, E. C., N. G. Hall, S. A. Hesp, P. G. Coulson, and I. C. Potter. 2017. Age and growth rate variation influence the functional relationship between somatic and otolith size. Canadian Journal of Fisheries and Aquatic Sciences 74(5):680-692.
Bethke, B. J., and D. F. Staples. 2015. Changes in relative abundance of several Minnesota fishes from 1970 to 2013. Transactions of the American Fisheries Society 144(1):68-80.
Blackwell, B. G., and T. M. Kaufman. 2012. Timing of Yellow Perch otolith annulus formation and relationship between fish and otolith lengths. North American Journal of Fisheries Management 32(2):239-248.
Campana, S. E. 1990. How reliable are growth back-calculations based on otoliths? Canadian Journal of Fisheries and Aquatic Sciences 47(11):2219-2227.
Goldstein, H., and J. R. H. Michael. 1995. The graphical presentation of a collection of means. Journal of the Royal Statistical Society. Series A (Statistics in Society) 158(1):175-177.
Niewinski, B. C., and C. P. Ferreri. 1999. A comparison of three structures for estimating the age of Yellow Perch. North American Journal of Fisheries Management 19(3):872-877.
Vandergoot, C. S., M. T. Bur, and K. A. Powell. 2008. Lake Erie Yellow Perch age estimation based on three structures: precision, processing times, and management implications. North American Journal of Fisheries Management 28(2):563-571.
Tables
Table 1. Female Yellow Perch average age per 10-mm length bin for the study lakes sampled with experimental sampling gear in August 2019. Average age was calculated by combining age estimates from all gears (fine mesh gill nets, electrofishing, and standard nets). Ages were omitted if less than one fish per length group were examined. The 300 mm length group represents all fish aged that were 300 mm or greater.
- Zebra Mussels Confirmed in Elkhorn Lake | October 25, 2018
Elkhorn Lake is now the 11th lake in Kandiyohi County to be infested by zebra mussels.
The Minnesota Department of Natural Resources reported on Thursday that it has confirmed zebra mussels in Elkhorn Lake. The 79-acre lake is located southwest of Green Lake, where zebra mussels were confirmed in July of 2014.
DNR fisheries staff from Spicer initially found one zebra mussel on the northwest side of Elkhorn Lake. Three DNR staff performed a dive search that did not reveal additional zebra mussels. DNR staff subsequently found individual adult zebra mussels while searching equipment in the water on opposite sides of the lake, according to the DNR.
The small lake has a maximum depth of 41 feet, and is known for the clarity of its water. It is ringed by residential development with the exception of its northwest shoreline. It offers fishing opportunities for largemouth bass, bluegill and northern pike.
It is considered to be among the 18 lakes best known for recreational and fishing opportunities in the county.
The discovery of zebra mussels in Elkhorn Lake means that the invasive species is now present in the Crow River, Hawk Creek and Shakopee Creek watersheds. Infested lakes in Kandiyohi County now include Andrew, Calhoun, Eagle, Elkhorn, Florida, Games, George, Green, Henchen, Norway and Swan.
Now is an important time to check for invasive species as docks and lifts are removed from lakes.
Minnesota law requires keeping docks and lifts out of the water for at least 21 days before putting them into another body of water.
The DNR recommends these steps for lake property owners:
Look on the posts, wheels and underwater support bars of docks and lifts, as well as any parts of boats, pontoons and rafts that may have been submerged in water for an extended period.
Hire DNR-permitted lake service provider businesses to install or remove boats, docks, lifts and other water-related equipment. These businesses have received training on Minnesota’s aquatic invasive species laws and many have experience identifying and removing invasive species.
People should contact their area aquatic invasive species specialist if they think they have discovered an invasive species that has not already been confirmed in a lake. Take a photo of any newly discovered invasive species before removing it from equipment. Save specimens or leave them in place until the DNR can investigate.
- Clear Water Trouble | May 10, 2018
Green Lake is known for its walleye fishing and deep, crystal clear water.
Those are among the reasons why it was chosen to host the Minnesota governor's fishing opener this weekend.
But the improved clarity — due in part to the lake's growing population of zebra mussels — is changing the lake and its inhabitants in ways experts are still trying to understand.
"We have a lot of people who say to us, 'Well, isn't clearer water better water?'" said Charlene Brooks, aquatic invasive species program coordinator for Kandiyohi County. "But in reality, clearer water in many cases is less productive, meaning there's less food at the base of the food chain for the creatures — the fish that we like to fish for."
Green Lake has always had clear water. But since zebra mussels were discovered in the lake about four years ago, the water clarity has increased significantly.
"From 2016 to 2017, we've seen a pretty significant increase in the numbers of zebra mussels in the lake itself," said Gary Montz, a research scientist with the Minnesota Department of Natural Resources' ecological and water resources division.
Green Lake's zebra mussel population is still in its early growing stage, Montz said, so it's difficult to predict its impact.
"If you have clearer water, you may see aquatic plants growing at deeper depths than you have seen before because the sunlight can penetrate deeper," he said. "You may see an increased abundance of the aquatic plants. You may see denser beds or stands of the aquatic vegetation."
Zebra mussels are found in more than 100 Minnesota lakes. They are filter feeders, straining out microscopic algae called phytoplankton that other species rely on for food.
Experts say it's not yet clear what impact zebra mussels are having on Green Lake's fish.
DNR surveys have found a decrease in the number of walleye in Green Lake, said Dave Coahran, Spicer area fisheries supervisor. But Coahran said there's also less fishing pressure for walleyes, as anglers switch to other species such as bass, sunfish and crappies.
"So there's less walleyes caught and harvested, but the people who target walleyes still do about as good as they used to," he said.
As Green Lake changes, it's facing other threats. Another invasive species, Eurasian milfoil, showed up about 18 years ago.
Just a few miles away, Lake Koronis is dealing with a troublesome invader known as starry stonewort, a pesky algae that forms dense mats, making it tough to boat or swim. There's a fear starry stonewort could spread to other area lakes, said Wendy Crowell, DNR consultant on aquatic invasive species management.
• Related: Michigan is now the clearest of the Great Lakes, thanks to invasive mussels
"Certainly people who are boating out on the lake should keep an eye out for an unusual plants, and clean all the plants off your boat and trailer," Crowell said.
Kandiyohi County and the Green Lake Property Owners Association are working to keep new invaders out. Inspectors check boats from sunup to sundown all summer at all six of the lake's public accesses.
Brooks said she worries about new invasive species showing up that aren't even on people's radars yet.
"We tend to talk about the same cast of characters, not realizing that there are countless species that we have not heard of or are not familiar with that are capable of causing a whole new level of damage," she said.
- Zebra Mussel Confirmed in Green Lake | August 1st, 2014
8/1/2014 - The Green Lake Property Owners were recently informed, and the DNR has confirmed, that one adult zebra mussel was found by a Green Lake home owner on a southeast shore dock. With measured optimism, we also want to report that a more extensive search of the area turned up no additional mussels.
The appearance of this lone zebra mussel is very concerning, especially because the Green Lake Property Owners Association has been working diligently to fight the spread of all aquatic invasive species for several years. While we do not know the final outcome of more searching and more testing for zebra mussels, rest assured that our battle against ALL aquatic invasive species continues and remains a top priority. We take comfort in knowing that we are still in the fight and now offer public washing station for all boats that enter and exit Green Lake. Please help us spread the word about this important community resource.
Why? Because we do not know the outcome of this recent news, and there are many other aquatic invasive species to watch for and be concerned about. July 1, 2014, the State of Minnesota release dedicated funds to help prevent the spread of aquatic invasive species in the lakes of Minnesota. This is good news and the GLPOA will work hard to benefit from these available funds.
Hopefully, this zebra mussel scare is an isolated find. But if not, we will work hard to educate ourselves on the best ways to live with zebra mussels in Green Lake. Either way, it should be a wakeup call for all of us to take action and spread the word about property preventative care. Aquatic invasive species are coming they are here to stay. We can not win this war without working together and forming partnerships will concerned residents of our community, our region, and our great state! WE can stand back and watch it happenor we can work together to find unique ways to deal with it.
This past week, 28 July 2014, Nick Brown of the DNR Invasive Species Department was on Green Lake to take water samples to see if they could located a veliger, which are the larva of zebra mussels. Samples were submitted to the St. Paul Office of DNR, with the results returning "negative!" They could not find any veliger within the water samples taken, which is good news.
A full press release will be forthcoming from the Department of Natural Resources on Monday, 04 August 2014.
Rest assured that the Green Lake Property Owners Association and our partners will stay focused on our mission to Protect, Enhance, and Restore Green Lake and all of the wonderful lakes we have been blessed with in our state.
Jamie Duininck, President GLPOA
Lake Events
Event Date
Event Date
Event Date
Green Lake History
- Fourth of July
July 4th in Spicer has been observed with a celebration since 1887. The earliest pictures found of a parade are from 1904.
Local business places erected floats advertising their establishments, and those floats were horse drawn at that time. The next picture is from 1917. Now the floats are pulled mostly by automobiles.
Almost always held on the morning of July 4, the parades have attracted thousands of people from far and wide. People often meet friends they see only on that holiday.
Always two bands were in Spicer to entertain people – from Danube and from Raymond. There were no high school bands in the early years. Spicer had a men’s band and a ladies’ orchestra. The first director was Mr. Swallin of Willmar; later the director was Enoch Lindholm, the local barber. New London also participated. The Salvation Army band from Willmar was also popular.
During the afternoon of the Fourth, these bands would put on concerts in the town park, where there was a bandstand. Many times there were speakers, such as dignitaries from county or state, politicians, mayors, the governor.
Many families had picnics in the park. They would just spread a blanket or cloth on the ground and enjoy the chicken, potato salad, lemon pie, and watermelon, all without benefit of refrigeration.
Booths were set up along the sidewalk by different organizations – churches, Scouts, Legions – anyone who wanted to make money. Workers cooked coffee in a large coffee pot, fried hamburgers, cooked hot dogs, served lemonade, and sold bottles of pop from a tub of ice. With no paper plates or cups, people washed dishes in a dishpan.
There were also four or five eating places within a block, a popcorn stand or two, an ice cream store. Cones were 5 cents, sundaes 10 cents, floats and malts 10 cents, pie 10 cents, hamburgers 10 cents, hot dogs 10 cents, coffee 5 cents and pop 5 cents. A noon dinner for 50 cents included soup, meal, dessert and beverage. Young girls could get a job washing dishes, for instance, at a restaurant for $1 a day (maybe for three days if the holiday was over a weekend).
One year Saturday was a beautiful, hot but nice. That night the lake flies move in. By Sunday morning there was no way that anyone even wanted to be outdoors. Trucks came and scooped up bushels of flies and moved them out.
Downtown Spicer was the center of attraction. A bingo stand and other games of chance were always available. The golf course was in the south end of town, as well as the ballpark. The merry-go-round and the Ferris wheel operated by Schinkles were popular with everyone. At times an outside carnival would come in.
Harold Thorvig was an electrician working for E.N. Farness hardware. He had equipment on a pickup by which he could speak through a loudspeaker announcing the activities that were taking place as well as advertising goods.
Fireworks have always been displayed during the evening of the Fourth. For example, the Spicer City Council minutes from a special meeting on January 18, 1929 read: “…it was decided to get 25 pounds of high explosives for the evening of the 4th.” Many residents around Green Lake draw up to Spicer in their boats to watch the display. Since the advent of lighted motorboats, their procession, in the dark, back to their landings, has been a show in itself.
Nowadays many high school bands participate in the parade, and many cities are represented by floats carrying young ladies selected as queens and attendants. Miss Spicer and two princesses make appearances at several celebrations during the year all around the state. Their coronation is always on July 4.
In these later years, a large flea market has been held, volleyball competition has been held on Saulsbury Beach, and softball games have been played at the new ball diamond.
Green Lake continues to be a popular place. The lake is busy in summer and winter. There are watercraft of every description and water-skiing shows, sailboat races, fishing derbies, snowmobile and all-terrain vehicle races, as well as annual road races and triathlons. Spicer is for all seasons.
- 50 YEARS OF GIRL SCOUTING IN SPICER
In 1941 the first Girl Scout troop was organized in Spicer. There has been continuous Girl Scouting in Spicer for these fifty years. Records show that four women formed the first troop committee and continued in this capacity until 1956--these were: Mrs. E. Farness, Mrs. Oscar Gustrud, Mrs. E. J. Rykken, and Mrs. Sig Simpson.
Among the names of Girl Scout volunteers serving in the sixties and seventies we find Gladys Thompson, Leila Wenzel, Donna Woodhall, Lillian Doty, Betty Midby, Marion Rime, Luella Krause, Gwen Fredeen, Ruby Engwall. There were many others as leaders, troop committee members, council board and committees. Mrs. Jo Thompson served as president of the Peacepipe Girl Scout Council in the 70's.
Spicer was one of the six communities who shared in the purchase and development of Nest Lake Girl Scout Camp (later to become Camp Sanderson). In 1947 Spicer, Buffalo Lake, Danube, Olivia, Montevideo, and Willmar raised the funds to purchase 33 acres on the east shore of Nest Lake. Spicer Girl scouts donated the first flag pole on the site. E. J. Rykken, Sig Simpson and Carl Engwall were among the first men to become active in Girl Scouting in the area as they helped to raise funds and work on the improvements on the site. Val Johanson and Karen En-wall were members of the camp staff for several years.
These fifty years of Girl Scouting in Spicer have seen many changes but the interest and dedication of the community have given many girls the opportunity to be in the scouting program. Spicer has been a good host to the thousands of little girls and adults who have camped at Camp Sanderson.
- Mardin was Depot Agent at Spicer for 27 Years
A. G. Mardin, 96, died in June of 1953 after a lingering illness at Waite Park. He was born in Cross Plains, Wisconsin, April 16, 1858, and came to Minnesota in 1878.
Mr. Mardin spent most of his life at railroad work starting at Spicer, where he worked for 27 years before coming to Waite Park. He was a telegrapher and paymaster from 1915 to 1928 when he retired from that post.
Following his retirement he lived in Portland, Oregon, with his son, William, for 10 years, returning to Waite Park in 1940 where he resided with his daughter, Mrs. A. G. Brandes.
Mr. Mardin was an active member of the Waite Park Methodist church and Sunday School. He was the oldest veteran of the Great Northern railroad.
Mrs. Mardin and two children preceded him in death.
He was survived by the following children: William, Sueterleun, Oregon; Louis H., Spokane, Washington; Bert, San Jose, California; Mrs. Norman Christensen (Cressie), Spicer; and Mrs. A. G. Brandes (Jenny), Waite Park. There were 11 grandchildren and 10 great grandchildren.
Services were held at the Waite Park Methodist Church with Rev. Swan Mattson officiating. Burial was in the Spicer cemetery in Spicer.
- AMERICAN LEGION AUXILIARY
The first meeting to organize an Auxiliary to the Henderson-Lewis Post #545 was held February 25, 1954, at the home of Mrs. Albert Qo) Block, with Mrs. Art (Betty) Midby as president pro tem. At this meeting the women voted to hold a meeting in the Village Hall on March 8,1954, to elect officers. On April 12,1954, the following officers were installed by Mrs. Walter Huckle of Appleton, Minnesota, who was the 7th District vice president. Also present was Mrs. Lester Ramey of Atwater, 7th District president. These were the first officers: President, Mrs. Henry (Flora) deCathelineau; I st Vice President, Mrs. Lester (Marion) Rime; 2nd Vice President, Mrs. William (Dorothy) Fritz; Secretary, Mrs. Albert (Jo) Block; Treasurer, Mrs. Lawrence (Lois) Heglund; Chaplain, Mrs. Charles (Norma) deCathelineau; Sergeants-at-Arms, Mrs. Albert (Myrtle) Ardoff and Mrs. John (Norine) Butler; Executive Board, Mrs. Dale (Olyve) Caylor and Mrs. Lawrence (Lois) Heglund; Publicity, Mrs. Wesley (Ann) Christensen; Historian, Mrs. Albert (Jo) Block.
Meetings were held at the homes of the members until the Legion Hall was built. The first meeting in the new facility was May 9, 1955.
The charter was granted June 7, 1954, with 37 names printed on it. They were the following: Mmes. Alfred (Edith) Anderson, Albert (Myrtle) Ardoff, Albert (Jo) Block, Miss Marcia Bloomquist, Mmes. LeRoy (Hazel) Brown, John (Norine) Butler, Norman (Cressie) Christensen, Arnold (Lillian) Christenson, Charles (Norma) deCathelineau, Edward (Gladys) Doyle, William (Dorothy) Fritz, Oscar (Vanita) Gustrud, Nels J. (Sarah) Hansen, Lawrence (Lois) Heglund, R.E. (Ardith) McLaughlin, Gilbert (Maret) Rime, Carl (Mabel) Samuelson, Albert E. (Edith) Thompson, Vernon (Verdilla) Anderson, Rolf (Marie) Arnesen, Wayne (Shirley) Block, Edward (Vivian) Bloomquist, Carl (Florence) Bratberg, Dale (Olyve) Caylor, Wesley (Ann) Christensen, Carl (Annie) Crevier, Henry (Flora) deCathelineau, Erwin (Gillenora)
Farness, Elmer (Selma) Gravgaard, Alton (Phyllis) Guttormson, Clyde (Fairy) Hawes, Merrit (Florence) Jordan, Arthur (Betty) Midby, Lester (Marion) Rime, Raymond (Ellen) Svejda, Henry (Deloris) Thompson, and John (Donna) Woodhall, Jr.
Gold Star Mothers were Mrs. Ellen Normile, Mrs. Willie Swart, Mrs. Harry Allen, Mrs. Jerry Bidwell, Mrs. Ernest Schultz, Mrs. Lars Wig, Mrs. Helen Goswick, and Mrs. F. A. Tourtelotte.
The Auxiliary sponsors Girl Scouts, Legionville, Girls' State, Red Cross Bloodmobile, American Education Week, and a group of ladies get together regularly to sew articles for the Veterans Hospital.
- Belle of Green Lake Entertains a Double Wedding Party
On June 28, 1892, at 4 p.m. on that Tuesday afternoon, the Rev. D. T. Booth of Willmar tied the nuptial knot of Samuel Anderson and Miss Lillie Orred, and Albert Anderson and Miss Nellie Orred. The wedding took place in a bowery adjoining the residence of Mr. and Mrs. Nelson Orred, the parents of both brides. As soon as the wedding services were over, the company, invited, about 150 in number, was seated at once and heartily enjoyed an excellent wedding dinner. Afterwards the party hired the steamboat, and a circuit of the beautiful take was made. In the evening the company repaired to the hall and danced to their heart's content. Everybody in Spicer, and their friends, wish them, the two wedding couples, a happy and prosperous voyage through life.
Quoted from the "Green Lake Breeze"
- Boats on Green Lake
Who owned the first boat on Green Lake? Well, to be perfectly truthful, no one seems to know. Certainly among the earliest were William Cartledge and Andrew Holes, who in the spring of 1859, built a basswood scow to transport potatoes from Nest Lake down the Crow River to the Mississippi and then on to St. Anthony (Minneapolis). The story of their colorful voyage, as related in the "Illustrated History of Kandiyohi County," established the commercial navigability of the Middle and North Fork of the Crow River but left considerable doubt that such a route would ever be practicable, considering the obstacles they encountered.
George Nichols and his son Edgar built the darn at the inlet to Green Lake in the spring of 1867 and by early summer had a sawmill in operation. Under the supervision of Charles J. Sperry, millwright and first sheriff of Monongalia County, they also constructed a grist mill at the site. As a part of their business Nichols and Son had one of the first sail boats on Green Lake, and at one time made an attempt to establish a depot on the cast side of the lake to freight wheat, flour, and lumber to and from the mill by means of a barge.
The first steamboat on Green Lake was a 50-passenger catamaran named "Little Eva" purchased by William Olson in 1886. It was built in Hastings and for a number of years had been used on the Mississippi River between St. Paul and Hastings. Mr. Olson's first season in the tourist excursion business must have been a success for in March 1887; he traded the Chippewa County family farm for the "Star," a double-deck Minnetonka steamboat 85 feet long and 16 feet wide with a reported (and possibly exaggerated) capacity of 300 passengers. The boat was hauled across the ice of Lake Minnetonka to Wayzata on huge lumberman's sleds, loaded on two flat cars, and, accompanied by a bridge crew to open overhead bridges, transported to Spicer by train. At Green Lake it was overhauled, painted and rechristened "The Belle of Green Lake." It was used to transport tourists around Green Lake until 1890. The boat was traded for land near Pierre, South Dakota, and in 1891 sold for taxes to S. H. Adams, who sold the machinery to parties from Belgrade. The "The Belle of Green Lake" came to a sorrowful end when the beached hull was crushed by ice. The wreckage lay on the lakeshore for many years and gradually disappeared, erasing all traces of what had to be the most famous boat ever to grace the waters of Green Lake.
The Steam Launch Iris on Green Lake
A number of smaller steamboats called steam launches, among which were the "Iris" and the "Green Lake Star," appeared in 1891 and 1892. Some carried as many as 75 passengers and made regular trips from Spicer to all parts of the lake. Those wishing to take pleasure trips were given a complete circuit of the lake for 25 cents. Launches powered by gasoline engines began to replace the steam engines around 1902, although steam boats were still being used on Green Lake as late as 1910.
Many of the early steam and gasoline launches were designed and built in Spicer in either the J. M. Alden boat factory or the Holt Boat Works. Early photos taken around the turn of the century show the beautifully designed, cedar lap-strake rowboats that were built by these firms. Due to the primitive condition of the roads, all of the resort hotels and a number of the more prosperous summer residents owned launches to transport their guests and supplies across the lake. Among the largest of the launches were those owned by D. N. Tallman and J. M. Spicer, which were 25 to 30 feet long. By the 1930's most of the launches had disappeared, having been gradually replaced by smaller boats powered by outboard motors or later in the 1940's by speedboats.
Boat on Green Lake by the downtown beach. Building in the background
is believed to be the Fairview Pavilion. Picture was taken in 1910.
Synonymous with the word speedboat was the name of George W. House, who from 1947 through 1955 operated his inboards from the downtown park. Art Fredeen built a metal inboard that proved to be the fastest on the lake. He also operated a concession giving pontoon rides. Throughout the years many different water-based concessions have served tourists, ranging from paddleboats, water bugs, and bumper boats up to seaplanes. At the present time a one or two person watercraft called a "Jet Ski" is a showy, expensive addition to the boats on Green. Our forebears would probably be pleased to see that sailboats continue to grace the lake but would probably be surprised by the remarkable speed that the twin-hulled catamarans can attain. These are perhaps not as fast as the iceboat "Arrow" built by George Holt in 1904 or the propeller driven iceboat built by Harold Thorvig but exciting nonetheless. Speed is required to water-ski and present day fiberglass and aluminum boats attain speeds where even skis are not required-exceptional individuals have mastered the art of water skiing barefoot.
Our forebears would also be pleased to see that fishing continues to be very popular but would also understand that due to this popularity, the catching is much poorer than when they rowed from Spicer to the Old Mill to catch a few big ones. They would also understand when we told them that many of us yearn for the much slower times when we could pack a picnic lunch, and together with the city band, simply take a cruise on "The Belle of Green Lake."
- BOY SCOUTS
In 1911 C.A. Hadden, the first scout executive, came to this area, assisting a group of men in making arrangements for organizing scout troops in Willmar and Kandiyohi County. As usually happens when something new is begun, he encountered many difficulties.
Longtime Spicer residents remember scouting in the area as being affiliated with the Minneapolis Area Council (now the Viking Council) and Karishon District. Campsites were at different locations-Spicer Point on Green Lake, Diamond Lake, where the community park is now, and the east shore of Nest Lake on land rented from Fred Gillette of Spicer. He gave permission to clear enough land to erect a dining hall and one or two service buildings to form a campsite.
In the early 1940's or before, Bill Henderson (a fishing guide) took it upon himself to take boys camping, fishing, and hunting; they would pitch tents and rough it around Woodcock Lake. Later Paul Bliven (school principal) and Albert Pederson organized a group that camped at Twin Lakes,
The first sponsor of the Boy Scout troop was the PTA of Spicer School. In 1946-1947 the first charter was signed with a bit of difficulty. Local business people were a bit hesitant. Carl Engwall was scoutmaster at the time.
The campsite at Nest Lake was turned over to the Girl Scouts in an impressive ceremony. A bonfire was lit on a raft on the pond at the campsite; as it burned out and the raft sank, the camp was turned over to the Girl Scouts and became known as Camp Sanderson, in honor of Lucile "Susie" Sanderson, a dedicated leader of scouts.
Since then the place of the large Viking Council camp has been on Many Point Lake, about 40 miles from Itasca State Park. Before they went to Many Point, Spicer boys camped at Annandale.
It is impossible to get the names of all the previous scoutmasters, den mothers, and leaders who have been responsible for the work that has been carried on. Some of the young men who became Eagle Scouts are Charles Midby; Dave Shemon; John, Doug, and Robert Woodhall; Robert Ehrlich, Jr. Surely there were others, and Spicer is proud of every one.
The American Legion is sponsor now. The support of people of the community has been loyal and generous and deeply appreciated by boys and leaders who have had and are having the benefit of scouting. A thank you is in order to all.